Evaluation
-
Create the data you need for the unified benchmark. But I will recommend to download directly from link, then we don't need to read Data Creation. Most important reason is Data Creation don't include manually labeled ground truth file. But the link we provided have the human labeled ground truth.
It will also help if you want to create your own dataset for benchmarking. Welcome to contribute your dataset to the community.
-
Evaluate the performance of the methods.
-
Compare the result and output the visualization automatically.
It's better to view this md file through outline. No need to go through all of them. 😃
Evaluation
This part include output the quantitative table and qualitative result automatically. To be updated scripts....
All the methods will output the clean map, so we need to extract the ground truth label from gt label based on clean map. Why we need this? Since maybe some methods will downsample in their pipeline, so we need to extract the gt label from the downsampled map.
0. Run Methods
Check the methods folder, there is a README file to guide you how to run all the methods.
Or check the shell script in 0_run_methods_all.sh, run them with one command.
1. Create the eval data
# Check export_eval_pcd.cpp
./export_eval_pcd [folder that you have the output pcd] [method_name_output.pcd] [min_dis to view as the same point]

# example:
./export_eval_pcd /home/kin/bags/VLP16_cone_two_people octomapfg_output.pcd 0.05
Or check the shell script in 1_export_eval_pcd.sh, run them with one command.
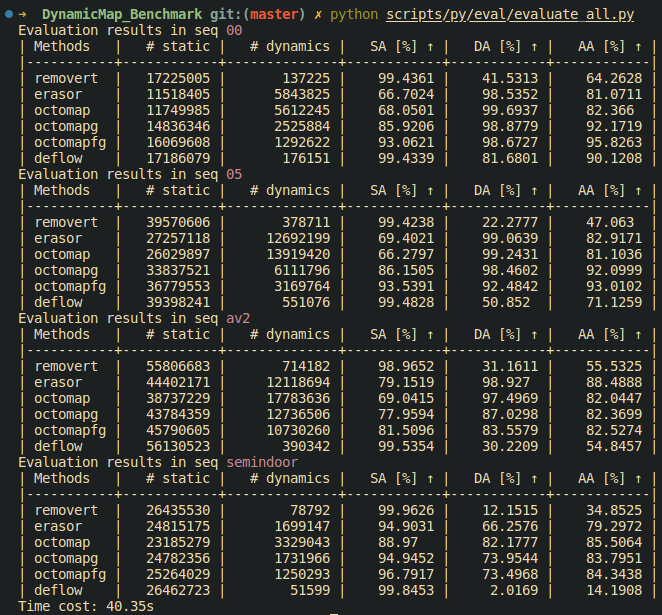
2. Print the score
Check the script and the only thing you need do is change the folder path to your data folder. And Select the methods you want to compare. Please try to open and read the script first
Here is the demo output:
3. Visualize the result
This jupyter-notebook scripts/py/eval/figure_plot.ipynb will help you to visualize the result and output the qualitative result directly.